
Executive Summary
Group Purchasing Organizations occupy a central and largely unquestioned position in the healthcare procurement ecosystem. Nearly every hospital in the United States participates in at least one GPO, and the strategy seems straightforward: aggregate purchasing volume, negotiate from scale, reduce sourcing overhead and secure pricing that standalone institutions cannot achieve on their own.
That value proposition seems obvious; GPOs provide contract access, pricing benchmarks, administrative efficiency and scale leverage that many organizations would struggle to replicate independently. The question is not whether they add value – the question is whether their economic structure is fully aligned with the financial objectives of the hospitals they serve.
It is not.
GPOs are funded primarily through administrative fees paid by vendors as a percentage of purchase volume, an arrangement permitted under federal safe harbor regulations. A GPO whose revenue scales directly with total spend cannot be perfectly aligned with aggressive enterprise-wide cost reduction objectives. Compliance frameworks limit the pursuit of lower-cost alternatives, local negotiating gains are often offset in part by GPO fee structures, and some of the most powerful cost levers, utilization management, standardization, make vs. buy, revenue enhancement and strategic partnerships fall largely outside GPO influence.
For a health system carrying $1 billion in annual non-labor spend, a one percent improvement in total economics represents $10 million in margin impact. At three percent, that figure rises to $30 million. For organizations operating on thin margins, those are not rounding errors, they are the difference between financial stability and uncertainty.
This paper examines where GPO incentives diverge from hospital interests, quantifies the financial stakes for executive leadership, and offers a framework for using GPO relationships strategically in a broader cost management strategy rather than relying on them to drive financial improvement goals.
The Historical Evolution of Group Purchasing Organizations
Group Purchasing Organizations began in the early twentieth century as cooperative buying arrangements among hospitals operating in fragmented markets. Individual institutions lacked scale and procurement sophistication, suppliers often dictated pricing, and administrative resources were limited. By pooling demand, hospitals gained leverage, reduced overhead, and secured better terms.
The modern GPO industry took shape in the 1980s when two forces converged. Reimbursement pressure intensified following Medicare’s shift to prospective payment systems, putting cost reduction at the top of every hospital CFO’s agenda. Simultaneously, Congress formalized the legal safe harbor permitting vendors to pay administrative fees to GPOs, a regulatory change that institutionalized a vendor-funded revenue model tied directly to purchasing volume and altered the economic foundation of the industry permanently.
Administrative fees provided scalable, predictable revenue that fueled consolidation. By the early 2000s, a small number of national organizations – Vizient, Premier, and HealthTrust Performance Group had emerged as dominant players overseeing hundreds of billions in annual purchasing volume. As health systems consolidated, GPOs expanded beyond basic contracting into physician preference items, capital equipment, analytics, purchased services, and advisory functions.
Today a hospital may simultaneously participate in a national GPO, a regional alliance, and an aggregator overlay, with pricing tiers and rebates dependent on compliance metrics across multiple portfolios. What began as cooperative purchasing has evolved into a complex, vendor-funded structure whose economics are not always transparent to the members it serves.
Where Misalignment Becomes Visible
Commodity and Medical-Surgical Categories
In commodity medical-surgical supplies, GPO pricing is structured around compliance. Diverting volume to a lower-cost alternative can jeopardize portfolio discounts across an entire category. The result is a structure in which hospitals are financially penalized for pursuing better economics outside the contract, not because the alternative is inferior, but because compliance thresholds protect fee revenue.
Physician Preference Items
National contracts in physician preference categories typically establish maximum pricing frameworks. Many organizations incorrectly treat these ceilings as the best available price. Local negotiations, particularly those supported by data and tailor-made strategies, frequently achieve significantly better terms. The gap between GPO contract pricing and locally achievable pricing in implants, cardiovascular devices, and other high-value categories can be significant and lead to multi-million-dollar savings potential.
Local Negotiations and Fee Capture
When hospitals do negotiate improved pricing independently, GPOs often prefer that those agreements remain on their contract paper, preserving administrative fee flows and compliance metrics. If pricing improvements originate from hospital-led effort but remain on GPO paper, administrative fees may still apply. The hospital captures some, but not all, of the value. The economics of the improvement are shared with the GPO even when the GPO contributed nothing towards achieving it.
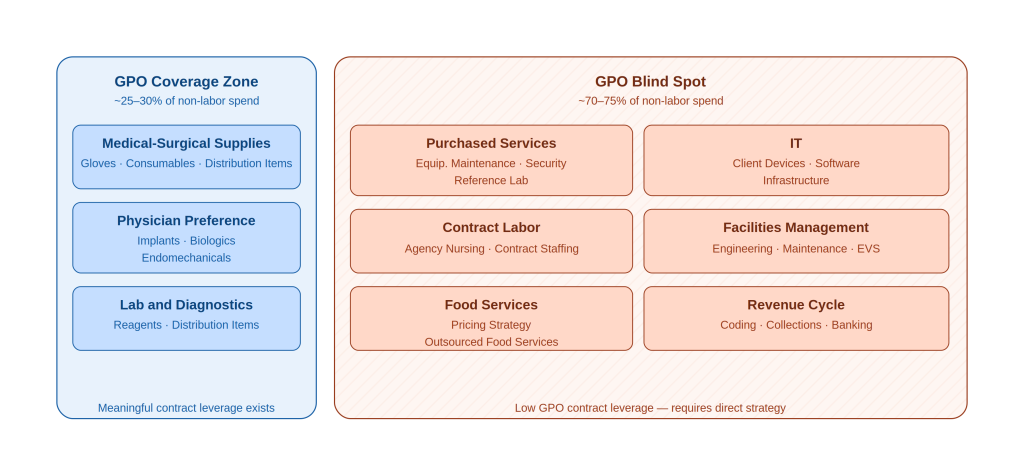
Figure 1. GPO coverage territory relative to total non-labor spend. Categories in the blind spot zone — representing 70-75% of spend — receive no meaningful GPO contract leverage.
Beyond Price: The Levers That Matter Most
Price is one lever among several in a comprehensive margin improvement program, and often not the most powerful one. Utilization reduction, standardization and vendor consolidation, make-versus-buy analysis, and strategic partnerships frequently deliver greater financial impact. These strategies are also largely GPO-agnostic and can directly reduce purchasing volume, ultimately reducing administrative fee revenue. The structural incentive to expand these efforts does not exist within the GPO model.
Purchased services such as IT, revenue cycle, facilities management, and outsourced ancillary and support functions represent approximately 30% of non-labor spend for most health systems and fall almost entirely outside meaningful GPO influence. External spend for supplies, pharmacy, and purchased services makes up 30 to 40 percent of a typical health system’s total cost base, yet only a fraction of that spend benefits from GPO leverage. In organizations where purchased services constitute 30 to 40 percent of non-labor spend – this is not a minor gap.
Financial Implications for Executive Leadership
For CFOs, CEOs, and Chief Supply Chain Officers, the structural dynamics described above are not abstract; they have direct impact on margins.
GPO contracts provide genuine value as a pricing floor. In most categories, they protect hospitals from obvious overpayment and establish a benchmark against which local negotiations can be measured. That is not nothing. But pricing benchmarks do not guarantee optimized total economics, and the distinction matters enormously at scale.
If GPO contract pricing reflects negotiated averages rather than fully optimized outcomes, the opportunity cost compounds every year. A health system that consistently accepts contract pricing as the destination rather than the starting point leaves meaningful margin on the table recoverable through more assertive local negotiation, utilization management, and category strategies that go beyond price.
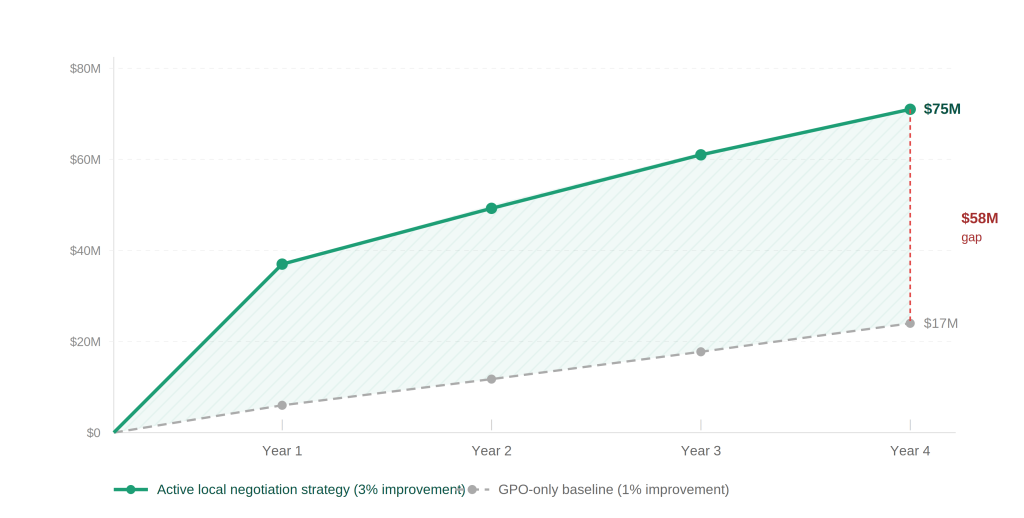
Figure 2. Five-year cumulative savings divergence. For a $1B non-labor spend health system, a 3% local negotiation improvement generates a $58M gap over four years compared to a GPO-only baseline.
The Administrative Fee Question
Vendor-funded administrative fees are embedded in the economic structure of GPO contracts. Many GPOs distribute a portion of these fees back to members as patronage dividends, rebates, or credits, and in large systems these distributions can reach seven figures or more annually. GPOs often cite these payments as evidence of aligned incentives.
However, administrative fees are paid by vendors and are ultimately embedded within the broader pricing structure of purchased goods and services. Member distributions represent a redistribution of GPO economics. Hospitals receive back a portion of the fee stream generated by their own purchasing activity. The question is whether the overall structure, including compliance constraints and category limitations optimizes total non-labor economics or merely returns a fraction of embedded costs.
If compliance requirements limit the pursuit of deeper savings, the net financial impact of distributions may be outweighed by missed optimization opportunities. A seven-figure distribution does not necessarily offset the cumulative cost of structural constraints across a billion-dollar spend portfolio.
The Economics of Local Negotiation
One of the most persistent misconceptions in GPO strategy is that moving spend off GPO contract paper creates unacceptable financial risk. In practice, the breakeven threshold is far lower than most organizations assume.
For a $10M category with a 2% admin fee rate and a 5% distribution rate on gross fees, the total fees-plus-distribution at risk when moving off GPO paper is approximately $210K representing a 2.1% pricing improvement needed simply to break even. Any local negotiation achieving better than a 2.1% price reduction creates net value for the hospital, with no floor on how much better that outcome can be.
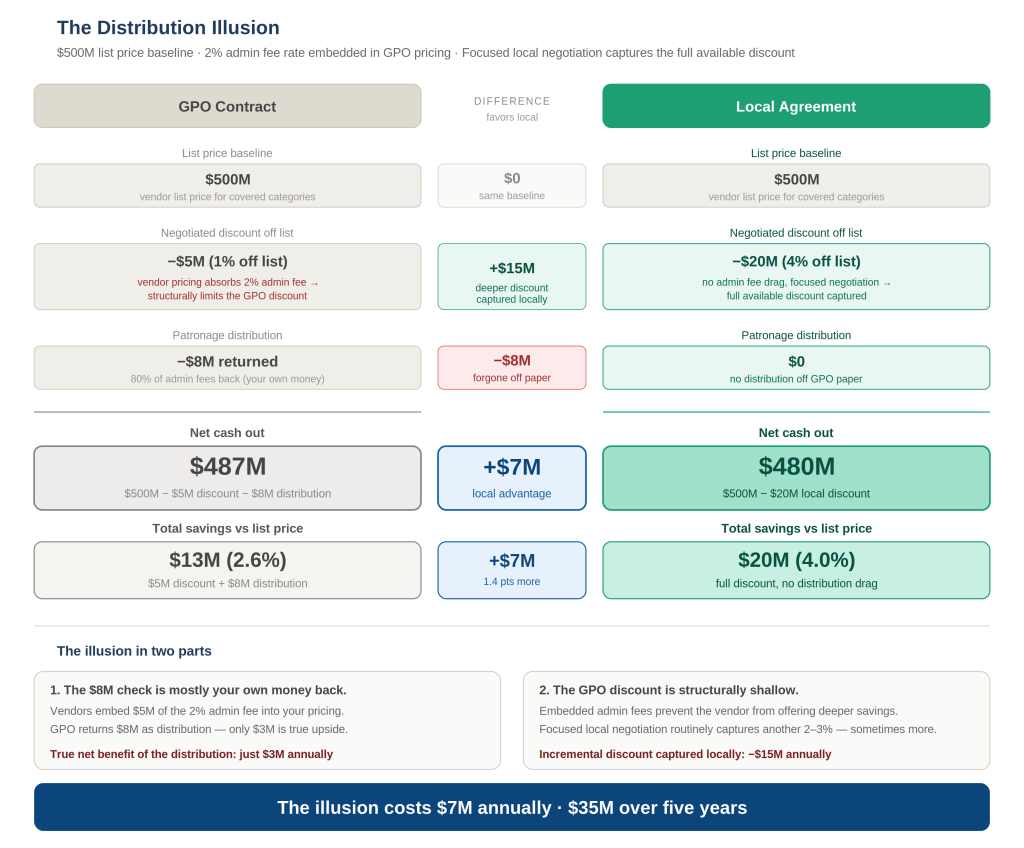
Figure 4. Illustrative example assuming $500M covered spend, 2% admin fee, 80% distribution, 1% net GPO discount, and 4% local negotiation discount.
What Optimization Looks Like In Practice
Pathstone has observed this misalignment firsthand. Working alongside health systems ranging from small rural hospitals to large multi-facility IDNs, we have consistently found that a focused, implementation-led approach that combines the institutional knowledge of the organization with market intelligence that goes deeper than benchmark data unlocks margin that GPO relationships are unable or unwilling to deliver. Across non-labor spend categories, that effort has translated to improvements of 5% or more beyond what existing GPO contracts were providing.
For example, a large IDN operating both adult and children’s hospitals had a fragmented reference lab partnership model with multiple vendors relying on GPO pricing, or in some cases no contract at all, with no meaningful leverage from volume consolidation or test-level negotiation. Pathstone facilitated a competitive RFP process, supported by test-level utilization analysis and market pricing intelligence, which resulted in consolidation around two primary reference lab partners. This support went beyond just the RFP, but also addressed internal stakeholder concerns to pave the way for smooth adoption and implementation. The new local agreements ultimately delivered best-in-class pricing with no annual spend commitments, simplified vendor management, and generated more than $2M in annual savings, none of which the existing GPO relationship had surfaced or pursued.
In another instance, a regional health system was fully compliant on its GPO ortho/trauma surgical supplies contract, capturing the top tier discount and an annual distribution payment of approximately $180K. While this seemed optimized, Pathstone’s analysis went deeper, modeling the full potential cost reduction including pricing, fees, and utilization patterns rather than evaluating performance within the context of the existing GPO arrangement. That broader lens revealed significant variance between contracted rates and what a competitive market would return. A targeted RFI with a focused but intentionally reduced volume commitment leveraging best available pricing from multiple vendors (even though it dropped the organization out of its top compliance tier) produced a local agreement priced 15% below the GPO contract rate. The tier drop cost the organization its top-tier discount and some of its distribution, but even absorbing both, the net improvement was $660K annually.
A Path Forward for Executive Leadership
None of this argues for fully abandoning GPO relationships. The contract access, benchmark data and administrative infrastructure they provide are genuinely valuable, and most organizations would struggle to replicate them independently. The argument is for using GPO participation as one tool in a broader sourcing strategy rather than as a substitute for one.
Supply Chain and Finance leadership should be able to answer several foundational questions: What percentage of total non-labor spend is meaningfully influenced by GPO contracts? How are administrative fees structured, and what is their net impact on pricing economics? How frequently is GPO pricing independently benchmarked against market alternatives? How are locally negotiated agreements structured, and who captures the value of hospital-led improvements?
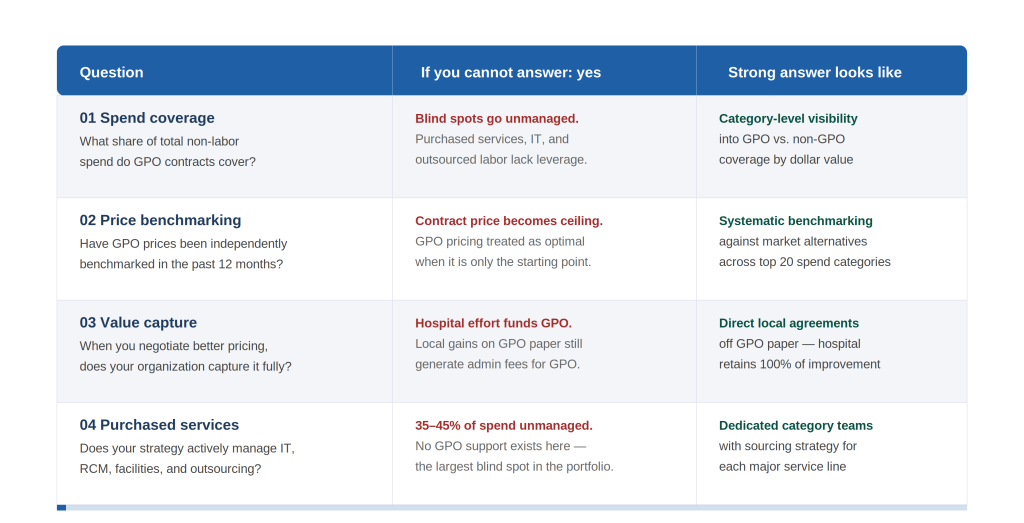
Figure 5. Executive diagnostic scorecard. Four questions to assess GPO optimization readiness. Organizations unable to answer “yes” to all four face material margin exposure.
Organizations that can answer these questions are in a position to use GPO relationships on their own terms, capturing the genuine benefits of contract aggregation while pursuing the deeper optimization that the GPO model is structurally constrained from delivering. Those that cannot are likely leaving margin on the table every year, compounding over time.
The most durable margin improvement programs in healthcare do not treat any single tool as a ceiling. They use GPO contracts as a floor, local negotiation as a standard practice, utilization management as a discipline, and standardization as a strategic requirement. That combination, not GPO participation alone is what fully optimizes non-labor economics.
Reach out to Pathstone Partners today to request a no-cost opportunity assessment and discover how we can help your organization plan for the future.
U.S. Government Accountability Office (2014). Group Purchasing Organizations: Funding Structure Has Potential Implications for Medicare Costs.
Wikipedia. Group Purchasing Organization — History and regulatory background.
Apenteng B.A. et al. (2024). Role of supply chain intermediaries in steering hospital product choice: Group Purchasing Organizations and biosimilars. PMC / NCBI.
Ott, J. / symplr (2024). The Overlooked Goldmine: Optimizing Purchased Services in Healthcare Supply Chains.
McKinsey & Company (2024). Optimizing healthcare supply costs — from the physician’s perspective.
McKinsey & Company (2022). Optimizing health system supply chain performance.
Definitive Healthcare (2020). How to control costs by balancing the supply chain.
Chief Healthcare Executive / symplr (2023). The 4 things supply chain managers wish healthcare executives understood.
Herrera, A. / Estudios de Economía Aplicada (2006). The Role of Group Purchasing Organizations (GPOs) in the U.S.